Bitcoin chart display for your desktop
Table of Contents:
- Intro
- Raspberry Pi customizations
- Install InfluxDB
- Install Grafana
- Setup the Python script
- Setup cron
- Configure Grafana for data visualization
- Raspberry Pi autostart script
Intro
Folks, I have to admit: looking at the Bitcoin price every day, every hour, every minute is not good for the owns mental health - doesn’t matter how you stand to Bitcoin in general. I personally couldn’t care less about the price, but a good friend of mine ask me to help with his “addiction”. So what are the options? Buy a (completely overpriced and hyped) LaMetric TIME? Build it with open source tools? We decided to be a litte bit more flexible in terms of what metrics we collect and how we display it.
The solution:
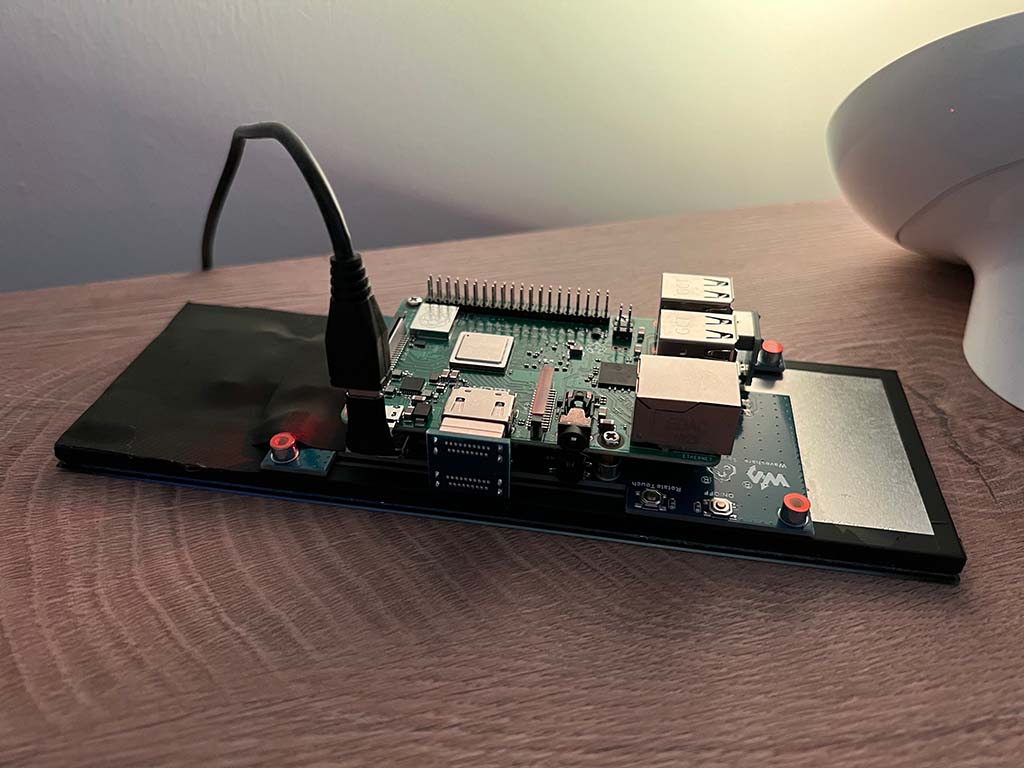
- an old Raspberry Pi (3 Model B)
- a cheap display
- some home lab infrastructure and finally:
- some scripting magic
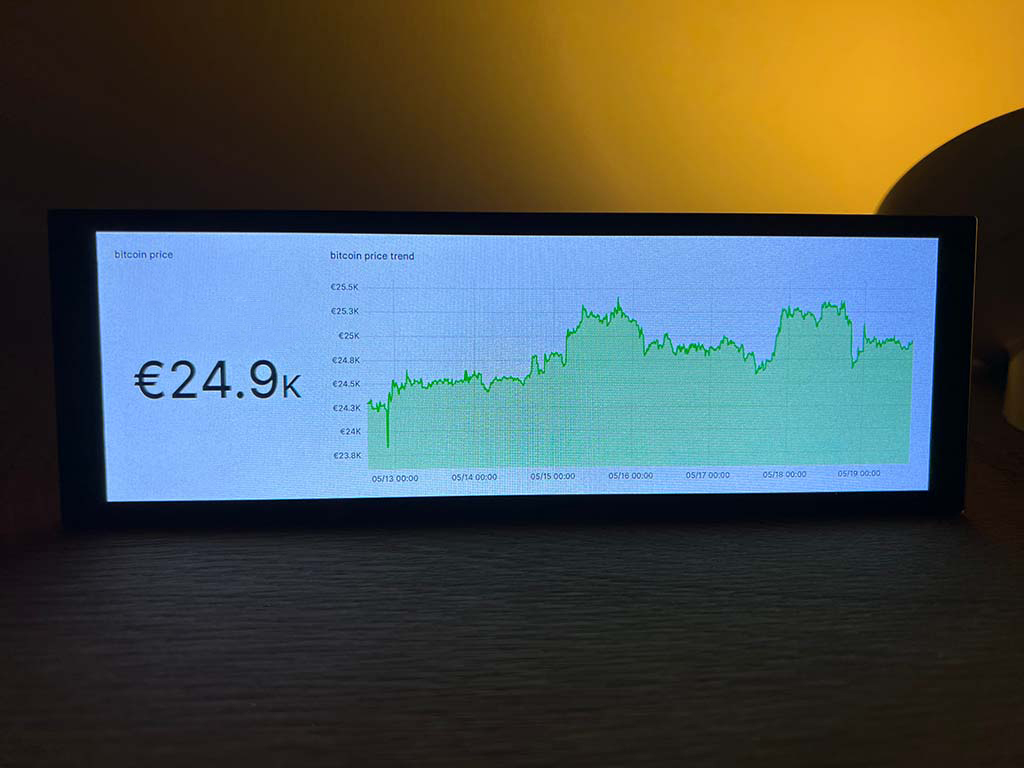
The end result looks like this:
What’s in our bucket list, what to buy (if you want to have the same and don’t have parts of it already laying around)?
- Raspberry Pi 3 or 4, doesn’t matter
- a suitable display, I can recommend that
Beside the hardware, we need some software to get the current price, save it in some database and then display it nicely. I’m using the follwing components (which can run either on the Raspberry Pi itself, or elsewhere in your network):
- Linux cronjob to execute a Python script for fetching the price data and storing it in a database
- InfluxDB as database backend
- Grafana as visualization tool
I will skip how to setup a Raspberry Pi and focus only on the specifics which are necessary for this project. As shown above, I used the Waveshare LCD in combination with a Raspberry Pi 3. If you’re using a different Raspberry or display, you will probably have different HDMI and touch display settings to apply.
Raspberry Pi customizations
The following is a copy-paste from here. Before attaching the display, you will need to modify the config.txt on your SD card to interact nicely with the LCD display. Just add the following lines:
hdmi_group=2
hdmi_mode=87
hdmi_timings=400 0 100 10 140 1280 10 20 20 2 0 0 0 60 0 43000000 3
display_rotate=3
Note that display_rotate=3 was the setting which worked for me, you will have to try out with what rotate setting you’re fine with. The possible rotation degrees are display_rotate=1 for 90°, display_rotate=2 for 180° and display_rotate=3 for 270°.
After booting and base setup, you have to modify the touch screen settings to align with the rotated screen:
Step 1: Install libinput:
sudo apt-get install xserver-xorg-input-libinput
Step 2: Create the xorg.conf.d directory under /etc/X11/ (if the directory already exists, proceed directly to step 3):
sudo mkdir /etc/X11/xorg.conf.d
Step 3: Copy the 40-libinput-conf file to the directory you created just now:
sudo cp /usr/share/X11/xorg.conf.d/40-libinput.conf /etc/X11/xorg.conf.d/
Step 4: Edit /etc/X11/xorg.conf.d/40-libinput.conf, find the part of the touchscreen (libinput touchsceen), add the following statement inside, and then save the file.
Option "CalibrationMatrix" "0 1 0 -1 0 1 0 0 1"
Step 5: Restart the Raspberry Pi:
sudo reboot
Again, the CalibrationMatrix option is based on the rotation:
- 90 degree rotation:
Option "CalibrationMatrix" "0 1 0 -1 0 1 0 0 1" - 180 degree rotation:
Option "CalibrationMatrix" "-1 0 1 0 -1 1 0 0 1" - 270 degree rotation:
Option "CalibrationMatrix" "0 -1 1 1 0 0 0 0 1"
Now we’re good to go with the (touch)screen itself, my recommendation now is to enable VNC via the sudo raspi-config command. Navigate to the Interface Options and select VNC, where you can enable the integrated VNC server. With that, you can connect to the Raspberry Pi with a VNC-client of your choice (e.g. Real VNC Viewer) by using <ip>:0 as address and your user credentials. This makes troubleshooting a little bit more easier.
Install InfluxDB
InfluxDB is a lightweight time-series database, ideal for our needs. You can either use Docker for that (which I personally recommend), or install it directly via packages. If you use Docker, you can use the follwing command (adapt it for your needs):
docker run -d \
 --name influxdb \
 --restart unless-stopped \
 -p 8086:8086 \
 -v /path/to/your/influxdb/data:/var/lib/influxdb2 \
 -v /path/to/your/influxdb/config:/etc/influxdb2 \
 -e DOCKER_INFLUXDB_INIT_MODE=setup \
 -e DOCKER_INFLUXDB_INIT_USERNAME=root \
 -e DOCKER_INFLUXDB_INIT_PASSWORD=ThisIsAVerySecurePassword! \
 -e DOCKER_INFLUXDB_INIT_ORG=home \
 -e DOCKER_INFLUXDB_INIT_BUCKET=initial \
 -e DOCKER_INFLUXDB_INIT_ADMIN_TOKEN=your-personal-admin-token== \
influxdb:2.7
Now login to the WebUI (http://<ip>:8086) with the init credentials you set in the Docker command, and create a new bucket - e.g. price_btc. A bucket is a small part of the overall InfluxDB database, comparable with a table in SQL databases, where our specific coin prices are stored.
Install Grafana
The same as InfluxDB, install via Docker or via packages. Adapt it for your needs.
docker run -d \
 --name=grafana \
 --restart unless-stopped \
 --user 0 \
 -p 3000:3000 \
 -v /path/to/your/grafana/data:/var/lib/grafana \
 -v /path/to/your/grafana/config/grafana.ini:/etc/grafana/grafana.ini \
 -e "GF_INSTALL_PLUGINS=grafana-clock-panel,grafana-simple-json-datasource" \
grafana/grafana-oss:9.5.2
Login to the Grafana WebUI (http://<ip>:3000) and under the burger menu on the left, navigate to Administration -> Data sources. We will now add the InfluxDB data source by clicking on Add new data source. Use the following values (see your InfluxDB Docker command).
Name: InfluxDB
Query Language: Flux
HTTP
    URL: http://<ip>:8086
InfluxDB Details
    Organization: home
    Token: your-personal-admin-token==
    Default Bucket: initial
Save & test. Should be working, if not: check network connectivity and Docker logs.
Setup the Python script
Now it’s getting interesting. We will use Python (3) to fetch the Bitcoin price and send it to InfluxDB for storage. First of all, let’s import the necessary pip3 packages on the host machine:
pip3 install influxdb-client pycoingecko
Next, we’ll start with a fresh prices.py file, containing our import statements, CoinGecko API wrapper and InfluxDB settings:
import influxdb_client
from influxdb_client.client.write_api import SYNCHRONOUS
from pycoingecko import CoinGeckoAPI

cg = CoinGeckoAPI()

influx_url = "http://<ip>:8086"
influx_token = "<token>"
influx_org = "<org>"
influx_client = influxdb_client.InfluxDBClient(url=influx_url, token=influx_token, org=influx_org)
query_api = influx_client.query_api()
write_api = influx_client.write_api(write_options=SYNCHRONOUS)
Then we’ll define our function to fetch the current price of the specific token, using the CoinGecko API wrapper. Adapt that with your ID (e.g. bitcoin) and the desired currency (in my case eur). You can find a list of valid IDs here.
def get_price(id, currency):
    try:
        raw = cg.get_price(ids=id, vs_currencies=currency)
    except Exception as e:
        error = "[ get_price ] error in function, exiting..."
        raise Exception(error)

    price = raw[id]["eur"]
    return float(price)
Next, we’ll define the function to write the price to the corresponding InfluxDB bucket (in our case price_btc).
def write_data(id, currency, bucket_name):
    payload = influxdb_client.Point(bucket_name).field("value", get_price(id, currency))
    try:
        write_api.write(bucket=bucket_name, org=influx_org, record=payload)
    except Exception as e:
        error = "[ write_data ] error in function, exiting..."
        raise Exception(error)
To finally write the data, we’ll execute the function write_data.
write_data("bitcoin", "eur", "price_btc")
The full python script looks like this:
import influxdb_client
from influxdb_client.client.write_api import SYNCHRONOUS
from pycoingecko import CoinGeckoAPI

cg = CoinGeckoAPI()

influx_url = "http://<ip>:8086"
influx_token = "<token>"
influx_org = "<org>"
influx_client = influxdb_client.InfluxDBClient(url=influx_url, token=influx_token, org=influx_org)
query_api = influx_client.query_api()
write_api = influx_client.write_api(write_options=SYNCHRONOUS)

def get_price(id, currency):
    try:
        raw = cg.get_price(ids=id, vs_currencies=currency)
    except Exception as e:
        error = "[ get_price ] error in function, exiting..."
        raise Exception(error)

    price = raw[id]["eur"]
    return float(price)

def write_data(id, currency, bucket_name):
    payload = influxdb_client.Point(bucket_name).field("value", get_price(id, currency))
    try:
        write_api.write(bucket=bucket_name, org=influx_org, record=payload)
    except Exception as e:
        error = "[ write_data ] error in function, exiting..."
        raise Exception(error)

def main():
    write_data("bitcoin", "eur", "price_btc")

if __name__ == "__main__":
    main()
Setup cron
To let the script run every 30 minutes (just an example), edit your crontab file by executing crontab -e and add the following:
*/30 * * * * python3 /path/to/your/prices.py
You can have a look at crontab guru to define your own cron expression.
Finally, restart cron by executing systemctl restart cron and you’re good to go. Let’s now see the data visualized.
Configure Grafana for data visualization
Grafana is a great tool for visualizing any kind of data from any kind of data source. We already set up our InfluxDB data source, the next thing is to create a dashboard containing the desired visualization elements (e.g. time series, bar charts, stats, gauges, heatmaps, etc.).
Open the Grafana WebUI (http://<ip>:3000), navigate to the burger menu on the left and select Dashboards. Here we can create a new dashboard and in that dashboard, add a new visualization. By default, we already get a time series panel with example data which we only need to modify.
On the bottom, select your InfluxDB data source and paste the following example query to get the Bitcoin price visualized:
from(bucket: "price_btc")
  |> range(start: v.timeRangeStart, stop:v.timeRangeStop)
  |> aggregateWindow(every: 2h, fn: mean)
Note that we’re defining
- the respective bucket
price_btc - the time range settings, which are in our case dynamically adjusted based on our overall time range for the dashboard
- an aggregation window, which normalizes the displayed output (you don’t want or need to display every data point when looking at data e.g. for the last 7 days)
Off course, you can play around with these settings and adjust it to your needs.
Now that we have a time series panel, we maybe also want to display just the current Bitcoin price statically. For this, you can do the same as above, but select Stat instead of Time series as panel type.
You can also download the whole dashboard shown in the picture above here.
Raspberry Pi autostart script
So we have set up the database, the visualization and the price fetching script. As the final part, we want the Raspberry Pi to display our dashboard when booting up, without manual interaction needed and without any confounding factors like a mouse cursor being displayed.
To do so, we’ll install two additional components:
Unclutterto hide the mouse cursor at inactivityGrafana Kioskto get the display into kiosk mode incl. automated logon
Unclutter
Install Unclutter via
sudo apt-get install -y unclutter
Grafana Kiosk
- Download the Linux ARM v7 package files from here
- Copy it to the desired folder:
sudo cp -p grafana-kiosk.linux.armv7 /usr/bin/grafana-kiosk - Set the desired permissions:
sudo chmod 755 /usr/bin/grafana-kiosk - Edit the autostart-file
$ vi /home/pi/.config/lxsession/LXDE-pi/autostart
@unclutter -display :0 -noevents - grab
grafana-kiosk --URL http://<ip>:3000/<your-dashboard-url-path> --login-method local --username <your-user> --password <your-password> --kiosk-mode full
Note that you’ll have to adapt the IP, dashboard URL path and username/password. The dashboard URL is basically the same as the URL displayed in the browser bar when opening Grafana in the browser.
After a reboot, the default browser should now be opened in kiosk mode and after automatic login, you should get the desired dashboard!
If you like posts like that and want to support me, some sats (see my about page) are highly appreciated 🧡